Beating degree is measured by draining a standardised pulp suspension through a calibrated screen and reading how fast the water escapes. A beating degree tester — most commonly a Schopper-Riegler (SR) freeness tester or a Canadian Standard Freeness (CSF) tester — converts that drainage behaviour into a single repeatable number that links refining energy to sheet properties.
Beating degree does not measure beating. It measures the drainage resistance of a pulp suspension, which is the practical consequence of beating. The distinction matters because the number on the instrument is an indirect, empirical index, and treating it as a physical property of the fibre is the first step toward misusing it.
When pulp is refined or beaten, three things happen to the fibres. They are cut and shortened. Their cell walls are delaminated and fibrillated, so the surface area increases. And fines are generated, which fill the spaces between larger fibres. All three changes make the suspension drain more slowly: fibrillation and fines increase the surface area that water clings to, and the fines physically plug the mat that forms on the wire.
A freeness test detects exactly that. The test suspension drains through a screen, a fibre mat forms almost instantly, and the rate at which filtrate passes through that mat is read as the result. Fast drainage means an unbeaten, open pulp. Slow drainage means a highly refined, closed pulp. Everything else — the instrument geometry, the sample mass, the water temperature — exists to make that one reading comparable between labs, shifts and years.
The reason the industry still runs on this indirect measure is that it is fast, cheap and correlates with what actually happens on the paper machine. Drainage rate controls sheet formation, drying energy, machine speed and, through the refining curve, most of the strength properties of the finished sheet. No faster measurement reproduces that bundle of information.
The two words describe the same measurement read in opposite directions, and mixing them up is the most common terminology error in pulp testing.
Freeness expresses how freely the suspension drains. A high freeness value means fast drainage and a lightly refined pulp. The Canadian Standard Freeness test reports in millilitres: a freshly refined mechanical pulp might read several hundred millilitres, while a heavily beaten stock reads close to zero.
Beating degree expresses the resistance to drainage. The Schopper-Riegler test reports in degrees SR: an unbeaten chemical pulp reads around 12 to 18 °SR, and a heavily beaten stock can exceed 70 °SR. Higher SR means slower drainage and more refining.
The two scales are inversely related but not linearly convertible, because the instrument geometries and the filtrate paths differ. Where a conversion is unavoidable, it must be done on the specific pulp type over the specific range measured, using an established correlation — never with a generic table.

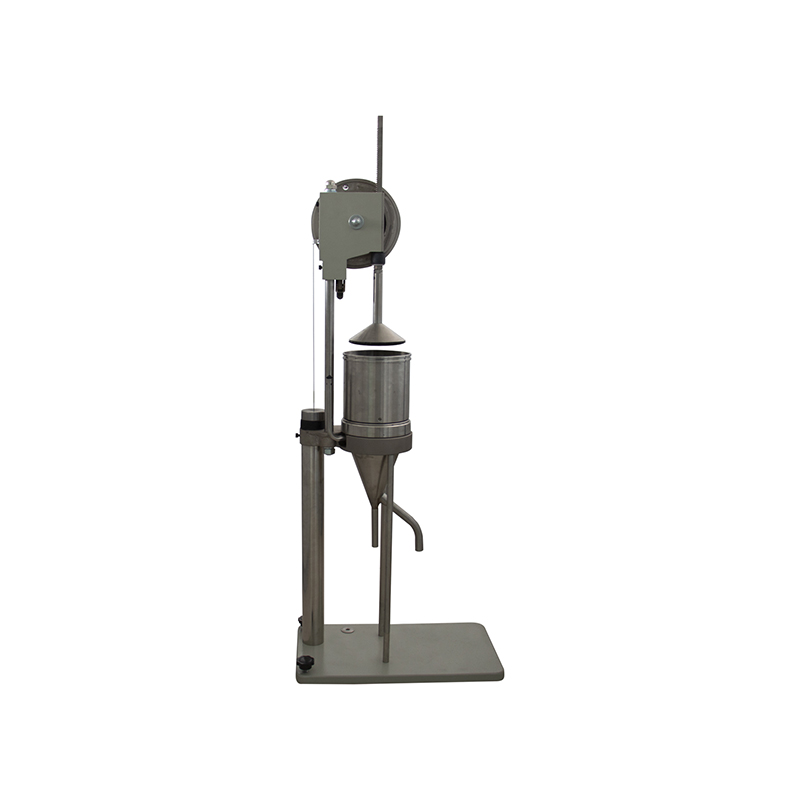
The SR method is standardised in ISO 5267-1, with equivalent procedures in TAPPI T 227 and GB/T 3332. The apparatus has three functional parts: a drainage chamber with a calibrated screen, a conical separating funnel with a side tube, and a graduated cylinder that reads the SR scale directly.
The procedure is short, which is why the test survives in every mill laboratory:
The reliable working range of the SR method is roughly 10 to 90 °SR. Outside that band the scale compresses and the reading loses discrimination. For very short-fibred, heavily beaten hardwood pulps, so much material passes through or blinds the screen that the reading becomes erratic; this is a recognised limitation of the method rather than an instrument fault.
The CSF method is standardised in ISO 5267-2 and TAPPI T 227. The apparatus shares the drainage principle with the SR tester but differs in geometry: the drainage chamber is larger, the sample is 3 g of oven-dry fibre, and the filtrate is divided so that the reading is the volume collected in a graduated cylinder over a 0 to 1000 mL range.
CSF is the traditional measure in North American mills and is widely used for mechanical pulps, refiner groundwood and recycled furnishes. Because the scale runs in the opposite direction to SR, a fast-draining unbeaten pulp reads high — several hundred millilitres — and progressive refining drives the number down toward zero.
Temperature effects are larger and more visible in CSF work, and the standard provides correction tables because drainage rate varies measurably with water temperature across the range a mill actually operates in. Labs that skip the correction between summer and winter routinely see a seasonal "drift" in freeness that is entirely an artefact of the dilution water.
| Aspect | Schopper-Riegler (SR) | Canadian Standard Freeness (CSF) |
|---|---|---|
| Standard | ISO 5267-1, GB/T 3332 | ISO 5267-2, TAPPI T 227 |
| Sample mass | 2 g oven-dry | 3 g oven-dry |
| Result unit | degrees SR (0–100) | millilitres (0–1000 mL) |
| Reading direction | higher = more beaten | higher = less beaten |
| Best suited for | well-beaten chemical pulps, fine paper stocks | mechanical pulps, groundwood, recycled fibre |
| Weak region | below ~10 and above ~90 °SR | near the bottom of the range on well-beaten stock |
| Regional usage | Europe, China, much of Asia | North America, and worldwide for mechanical grades |
Labs serving international customers eventually need both scales, and dual-scale instruments that share one drainage stand with interchangeable measuring sets are the practical answer.

A freeness reading is only useful when it is placed on a refining curve. The curve is built by refining the same pulp to a series of energy levels, measuring freeness and sheet properties at each step, and plotting the results. Once the curve exists for a given furnish, a single freeness reading predicts tensile, burst, air permeance and bulk without making a hand sheet at all.
The characteristic behaviour along that curve is consistent for most pulps:
The practical control target is therefore a window, not a number. A tissue producer may hold a low SR for bulk and softness; a sack paper producer refines into the range where tensile is high but tear has not yet fallen off; a filter paper maker refines lightly and accepts lower bonding to preserve permeance. What all of them share is that the freeness reading is the proxy that lets the refiner be adjusted in real time without a full sheet test after every change.
Because the measurement is empirical, every detail of the procedure is part of the calibration. The error sources below account for nearly all of the disagreement between operators and between laboratories.
| Error source | Effect on the result | Practical control |
|---|---|---|
| Sample consistency wrong | Directly proportional error; 10% consistency error moves the reading materially | Agitate the stock, calculate dilution volume from measured consistency |
| Water temperature off 20 °C | Drainage rate changes with viscosity; cold water reads as higher SR | Condition sample and water to 20 ± 0.5 °C; apply the standard correction table when impossible |
| Screen blinded or corroded | Reads as higher SR (slower drainage) | Clean after every test; inspect the wire under magnification monthly; replace on wear |
| Sealing cone speed wrong | Changes the initial drainage surge | Verify the lift speed against the standard at installation and after service |
| Instrument not level | Tilts the funnel and shifts the side-tube split point | Level with the built-in spirit level at each bench move |
| Inadequate dispersion | Unflocced samples read inconsistently | Disperse completely before dilution; never test a sample with visible flocs |
| Dilution water quality | Dissolved salts and surfactants alter drainage | Use consistent water; record source; re-baseline after any change |
Two of these deserve emphasis. First, temperature: a suspension tested at 15 °C and at 25 °C can differ by several SR points on the same pulp, which is larger than most process decisions. Second, screen condition: the screen is the actual measuring element, and it wears. A screen that is cleaned with a stiff brush every day will read differently from one that is rinsed, long before any visible damage appears.
A freeness tester is mechanically simple, which is exactly why its calibration checks are short and should be scheduled rather than skipped. The checks specified for SR apparatus verify the three dimensions that determine the reading:
| Check | Typical acceptance criterion | Frequency |
|---|---|---|
| Sealing cone lift speed | 100 ± 10 mm/s average | At installation and after any repair |
| Bottom orifice drainage time | 1000 mL of 20 °C water drains in 149 ± 1 s | Quarterly, or per standard schedule |
| Side-tube residual volume | 7.5 – 8.0 mL collected | Quarterly |
| Screen condition | No corrosion, distortion or blinding | Visual, each use; magnified, monthly |
| Spirit level | Bubble centred | Each bench move |
The bottom-orifice and residual-volume checks verify the funnel geometry that splits the filtrate between the SR scale and free fall. If either drifts, every reading the instrument produces is shifted by a constant, which is invisible in daily use because all readings move together. That is also why participation in inter-laboratory comparison, or at minimum a periodic cross-check against a second instrument, is worth the small effort: it is the only routine way to detect a uniform offset.
In a typical mill or laboratory flow, the beating degree test sits between refining and sheet forming. Stock is refined to a target, the freeness reading confirms the target, and the sheet former produces the hand sheet whose physical properties validate the setting. A change in freeness without a corresponding change in refining energy is a signal to look for: stock consistency change, broke addition, furnish mix change or a refiner plate problem.
The test also connects to a family of companion measurements that freeness alone cannot cover:
Laboratories that treat these as one package — freeness, classification and sheet properties — get a refining picture that is actually actionable. Laboratories that track only the SR number spend their time arguing about a single point on a curve whose shape they have never measured.
The manual SR tester remains the reference: simple, transparent, and easy to verify, with the reading taken by the operator from a graduated cylinder. Its costs are operator dependence and throughput — a careful manual test takes several minutes per reading including sample preparation.
Automatic instruments compress the cycle and remove the reading step: the drainage is timed and converted electronically, results are logged, and the operator's judgement is taken out of the endpoint. For a laboratory running many samples per day, or one where several operators with different experience levels share the bench, the consistency gain is usually worth the investment. For a teaching laboratory or a low-throughput quality bench, a manual instrument plus disciplined procedure delivers equivalent data.
What matters more than the manual-versus-automatic choice is standard compliance. An instrument should conform to the specific standard the customer's data will be compared against — ISO 5267-1 or -2, TAPPI T 227, GB/T 3332 — because the funnel geometry, screen specification and scale divisions are all defined by the standard and are not interchangeable. Buying an instrument that is "approximately SR" produces numbers that cannot be defended in a customer audit.
| Mistake | Consequence | Fix |
|---|---|---|
| Reporting SR without temperature | Results not comparable between shifts and seasons | Record and correct for 20 °C |
| Sampling from a settled stock | Consistency error dominates the reading | Agitate before sampling every time |
| Using SR on very short-fibre, heavily beaten stock | Erratic, non-reproducible readings | Switch to a method suited to the furnish, or treat with caution |
| Converting SR to CSF with a generic table | Systematic error outside the calibration range | Correlate on your own pulp, or run both scales |
| Cleaning the screen with abrasives | Screen damage shifts all readings | Rinse; replace the screen on a schedule |
| Comparing readings from two instruments without cross-checking | Hidden constant offset | Cross-check periodically on the same pulp |
A freeness number that cannot be traced is a number that cannot be defended, and the traceability requirements are modest compared with the benefit.
A complete record for each reading contains: pulp identification and furnish, the oven-dry sample mass actually used, the dilution water temperature with the correction applied, the instrument identification, the screen condition note, and the reading itself with the number of replicates. Where the reading feeds a refining decision, the refiner plate configuration and refining energy since the previous reading belong in the same record, because the pair is what makes the refining curve grow over time.
Replication is the cheapest audit tool available. Running the test in duplicate on the same prepared sample costs two minutes and immediately distinguishes process variation from measurement noise. A practical rule: when the difference between duplicates exceeds two SR points on chemical pulps or twenty millilitres on the CSF scale, stop and find the cause before reporting either number. The cause is almost always one of the error sources in the table above, and it is almost always cheaper to fix than the consequences of acting on a bad reading.
Trend presentation matters as much as the reading. A freeness value plotted against refining energy on the mill's own curve converts a quality record into a diagnostic tool: a point that sits above the curve indicates a drainage problem unrelated to refining, while a curve that shifts gradually over months usually points to screen wear or a stock consistency calibration error.
None of this requires software. A bench log with the fields listed above, reviewed monthly, captures most of the value. The laboratories that struggle are not the ones without data systems; they are the ones where the freeness reading is written down without the conditions that made it what it was.
The beating degree test survives because it converts a complicated fibre phenomenon into one number that predicts how a paper machine will behave. The SR and CSF methods are the two standard ways of producing that number, and they differ in geometry, sample mass and reading direction but not in principle.
What makes the number trustworthy is not the instrument's sophistication. It is the discipline around it: consistent sampling, controlled temperature, a clean and verified screen, and a refining curve built on your own furnish so that the reading has a meaning beyond the scale. A laboratory that maintains those habits gets decisions from every reading. One that does not gets a number that moves, without anyone able to say why.
What is the difference between beating degree and freeness? They are the same drainage measurement read in opposite directions. Beating degree (°SR) rises as refining increases; freeness (mL CSF) falls. The scales are inversely but not linearly related, so conversions should be established on the specific pulp.
How often should a freeness tester be verified? Verify the mechanical checks — sealing cone lift speed, bottom-orifice drainage time and side-tube residual volume — on a scheduled basis, typically quarterly, plus after any repair or relocation. The screen should be inspected visually at every use.
Why do two operators get different results on the same pulp? Almost always sampling consistency, temperature, or screen condition. The test is empirical, so procedural details are part of the calibration. A short checklist covering those three items resolves most disagreements.
Can I convert a Schopper-Riegler value to CSF? Only approximately, and only for the pulp type and range over which the correlation was established. Generic conversion tables introduce systematic error. Where both numbers are routinely required, use a dual-scale instrument.
What beating degree should my grade run at? It depends on the property balance the grade needs. Tissue and bulky grades run low SR to preserve bulk and permeance; sack and fine paper grades refine into the range where tensile is developed; filter grades refine lightly to protect air permeance. Establish the window from a refining curve on your own furnish rather than adopting another mill's number.
Does higher beating degree always mean stronger paper? Not indefinitely. Tensile and burst rise and then plateau as refining increases, tear peaks and then falls as fibres are cut, and bulk, opacity and drainage all deteriorate. Over-refining costs machine speed and drying energy for little strength gain.
Why does my freeness reading drift between summer and winter? Dilution water temperature changes drainage viscosity. If the correction table is not applied, the same pulp reads differently across seasons. Condition samples to 20 ± 0.5 °C or apply the standard correction.
What other tests should accompany a beating degree measurement? Fibre classification or screening to characterise fibre length distribution and shives, and hand-sheet physical tests — tensile, burst, internal bond, air permeance — to convert the refining setting into properties. Freeness alone describes only the drainage behaviour.


Shandong Annimet Instruments Co., Ltd., established in 2007, is a professional manufacturer integrating R&D, production, and sales of laboratory testing instruments and sample preparation equipment. With nearly two decades of industry experience, we are committed to delivering reliable quality testing solutions to clients worldwide.
Contact: +86 400-9933-057
Company Address: Factory Building 105, No. 155, Xinmao Qilu Science and Technology City, No. 299 Zidong Avenue, Tianqiao District, Jinan City, Shandong Province
E-mail: anmt_test@126.com
Fax: +86 0531-88092218
Copyright © 2026 Shandong Annimet Instruments Co., Ltd. All rights reserved
Карта сайтаЭтот веб-сайт использует файлы cookie, чтобы обеспечить вам максимально эффективное использование нашего веб-сайта.

 English
 Español
 Français
 العربية






 телефон
Комментарий
(0)